Intransitive preferences on real data
Economists like to make assumptions about the world, and one of the most commonly used is that agents behave rationally. This does not mean that economists think everyone behaves rationally all the time, it is just that the assumption generally works “well enough” and also makes our life easier.
It is also commonly assumed that rational agents have transitive preferences. In simple words, this means that if a person prefers A over B and B over C, he should also prefer A over C (of course the relationships are not limited to 3 alternatives). At first glance, this kind of makes sense, and even seems obvious. I wanted to know how true this is on real data.
Some time ago, I discovered the website chilecracia.org, which asked people for their preference over different political topics1. Proposals were paired randomly, and people simply had to click on the proposal they would prioritize (they could also say that they did not have any preference). After each vote, the website displayed a new pair of proposals, and participants could vote as many times as they wanted, the only restriction was that proposals were displayed randomly.
Here are some (translated) examples:
Pair 1: What would you prioritize?
Increase the autonomy of local governments.
Reduce tax rates for small businesses.
Pair 2: What would you prioritize?
Increase restrictions for selling and using firearms.
Increase the number of parks.
The website collected over 7MM votes in a couple of months and publicly released the data, so this seemed like a great opportunity to test the transitivity of preferences of real people on a large scale.
Reframing the problem
To analyze the data more easily, we have to translate the problem of finding intransitive preferences into a more standard problem.
To do this, we can represent each person’s votes using a directed graph. Here, each node will be a proposal and two nodes will be connected with an edge only if the person has compared the two. The edge will point towards the least preferred option (the direction is not relevant as long as it is consistent for every option).
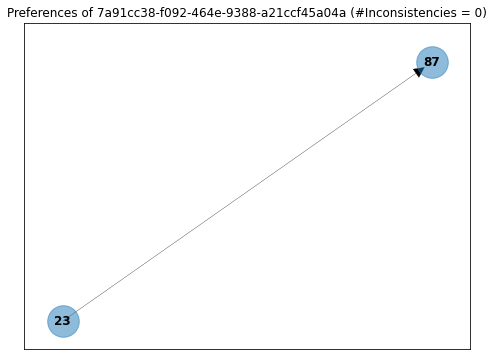
For example, here are the preferences of user ...-a21ccf45a04a. From the definition above, we can see that he has voted only once and that he prefers proposal 23 over proposal 87.
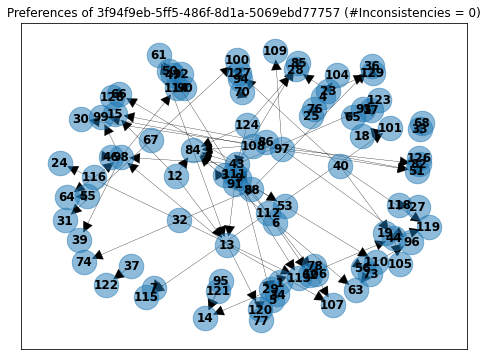
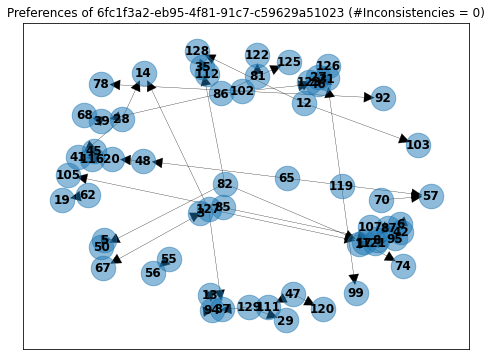
Here is a more complex example with over 100 votes:
At this point, you may be wondering why bothering with this. The answer is that finding inconsistencies can now be translated into finding cycles in the graphs!
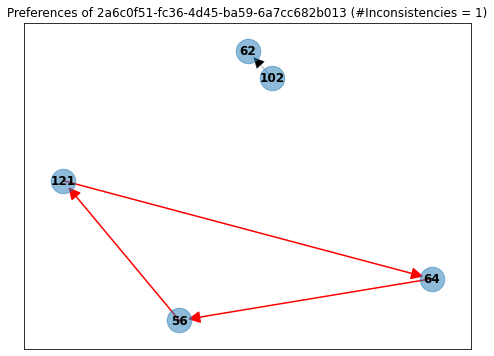
Take, for example, user ...-6a7cc682b013, who answered just 4 questions. On one, he said that he preferred proposal 56 over 121, on another that he preferred proposal 121 over 64, and finally that he also preferred proposal 64 over 56. This is clearly intransitive!
This has to be an isolated case. Right?
Implementing the graphs
To create the graphs, I decided to use NetworkX, mainly because the problem was not extremely big and because it is the cleanest network analysis library I have ever used.
The process of generating the graphs is straightforward: We load the CSV files with the votes, clean the data a little bit, code some functions that create the directed graphs for each user, and finally create another function that searches for the cycles. This should be easy to solve.
The major difficulty we have is that to obtain the percentage of the users who show intransitive preferences we need to discard cases where, by chance, users were asked to compare proposals that were “too disperse.” This means that we need to filter out users that did not have the chance of giving intransitive answers. To make this easier to understand, I will show two examples.
Here, a user that answered only four questions, and had the chance of being “inconsistent” (but ended up responding to the questions in a transitive manner).
showing intransitive preferences did not show any.
Here is another user that made 50 comparisons but (surprisingly) did not have the possibility of showing intransitive preferences. This means that even if he wanted to be “inconsistent” he could not.
Even if the user wanted, he could not have created a cycle.
To overcome this issue, we have to build the graphs with the data we had, but now we search for cycles ignoring the direction of the arrows (this is basically just using an undirected graph). If we cannot find any cycles in this graph, then we know the user never had the opportunity to show intransitive preferences.
Results
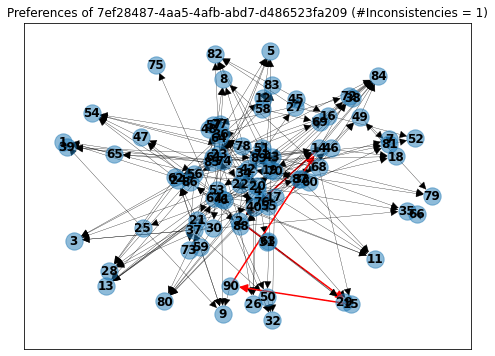
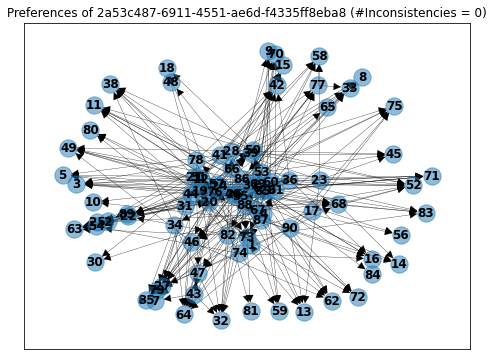
To my surprise, I found out that 38.39% of the users who had the chance to show intransitive preferences, actually showed one or more. Almost 40% sounds too much… until you see how complicated the graphs get! Here are some examples.
User ...-d486523fa209 answered 216 questions, on which he only rated 88 unique proposals. This means that on average he evaluated each option more than twice and showed only 1 inconsistency. That is actually impressive! (Would you be able to keep in mind all the 216 answers you gave?)
Even more impressive, user ...-f4335ff8eba8 answered 306 questions, on which he only rated 90 unique proposals and did not show any intransitive preferences!
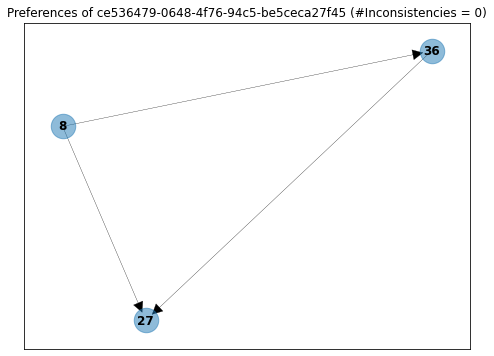
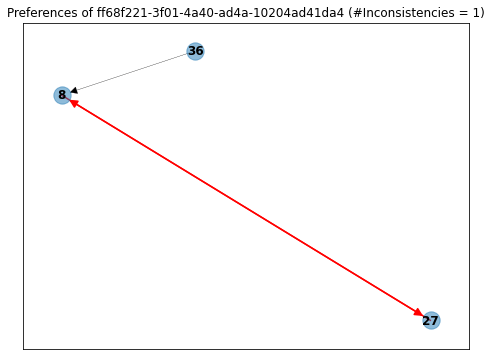
On the other hand, we also have users like ...-10204ad41da4, who answered only three questions and for some reason said that he liked proposal 8 more than 27, and after that, said that he liked proposal 27 more than 8.
I hope this simple exercise showed you how easy or complicated it can be to fulfill a “straightforward” assumption like transitivity2.
You can find all the code here and play with an online Jupyter Notebook here
.